

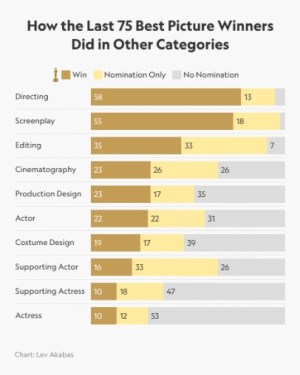
How The Last 75 Best Picture Winners (Academy Awards) Did in Other Categories
graph from Lev Akabas; slow reveal by Jenna Laib
Type of Graph: bar graph
Purpose
This slow reveal is designed to support analysis and discussion of both the data and the design choices. The questions in the slide deck invite learners to identify trends, estimate values, and consider what the data means.
About This Graph
This visualization is not provided for reuse or redistribution. Readers and educators are encouraged to view the original visualization in its published context.
Data Visualization Sources:
Akabas, Lev. “Academy Awards / Oscars Trends 🎬📊.” Instagram: March 13, 2026.
Accessed at www.instagram.com/p/DV1VRjYluAO/?img_index=4&igsh=dzNtcWFvNmFrY3Vn
Data Sources:
Unknown
Potentially wikipedia: en.wikipedia.org/wiki/List_of_Academy_Award%E2%80%93winning_films
or the Oscars website: www.oscars.org/oscars
In The Classroom
There are many different mathematical connections that can be made to this data and data visualization.
Potential Math Content: bar graph, stacked bar graph, estimating values, proportional reasoning, addition, sums, comparing data
Potential Content Connections: cinema, movies, Oscars, Academy Awards, fine arts
Discover more from Slow Reveal Graphs
Subscribe to get the latest posts sent to your email.
