What is a slow reveal graph?
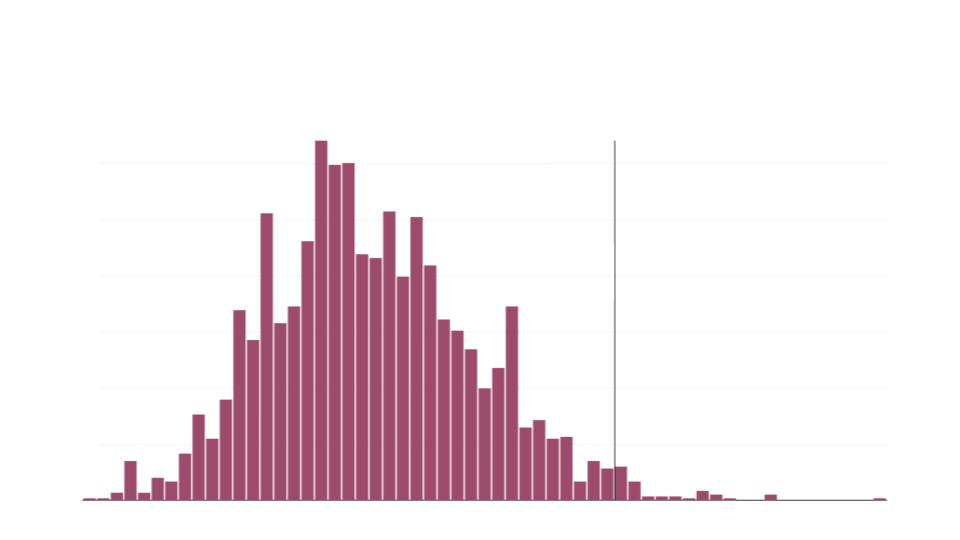
It starts with a graph that has been stripped of context: its numbers, its labels, its title. Like this.

The teacher facilitates a discussion around what students notice and wonder. Students might notice that the data is roughly symmetric, or that it is clustered around a central point. They might notice a long line running perpendicular from the x-axis. They might wonder what this line represents, since most of the data falls to the left of the line. They might wonder what this graph is about.
Then: another slide is revealed.

Students identify what information is new — in this case, the labels along the x-axis (increasing in increments of 200) and the label for the black line: “recommended dietary allowance 2,000 calories.” Is the x-axis showing calorie counts? From there, students can talk more about what they notice. Most of the data seems to be clustered around 1,000 calories. There are very few things above 2,000 and below 300.
Then: another slide is revealed.

The bars in a histogram are called bins (or buckets, or intervals). These bins represent a range of values. Which bin would you put these two meals (veggie bowl, carnitas burrito) into? Why?
What do you think is being measured along the y-axis?
Again, students identify what information is new (the title) and discuss how this changes their understanding of the graph. We now know that this graph is about the calorie counts of various meals at Chipotle. There are a few that seem to be greater than the recommended dietary allowance of 2,000 calories — in a single meal? What is m

Why do you think the graph is shaped the way it is?
We now know that the y-axis is measuring the percentage of meals at Chipotle that have that calorie count. More than 6% of meals have around 900 calories. Students might wonder how specific the calorie counts are.

Compose a headline for this graph describing the ‘big takeaways.’
More insight into this data representation is revealed. About 2% of meals have more than 2,000 calories!
This slow reveal graph, “How many calories do people really eat at Chipotle?” is available for Google slides. There are suggested questions to ask in the speakers’ notes of the slide deck.

The page for the graph also offers more information about the context for this graph, other content connections, and paired texts for students to explore.

So let’s get started! What would you like to do?
