
Comparing Climate in London and Singapore
graph from WeatherSpark; slow reveal by Leanne Thurlow
(Slide Deck includes notes and questions to elicit discourse)
Type of Graph: line graphs
Visualization Source: WeatherSpark.com, “Compare the Climate and Weather in Singapore and London.”
Data Source:
- WeatherSpark Data for Singapore (detailed description)
- WeatherSpark Data for London (detailed description)

Potential Math Content: line graph, change over time, scale along the y-axis, temperature measurement (fahrenheit vs celsius), averages,
Potential Content Connections: temperature, climate, perceived temperature, geography, data collection methodology, tourism
Paired Texts:
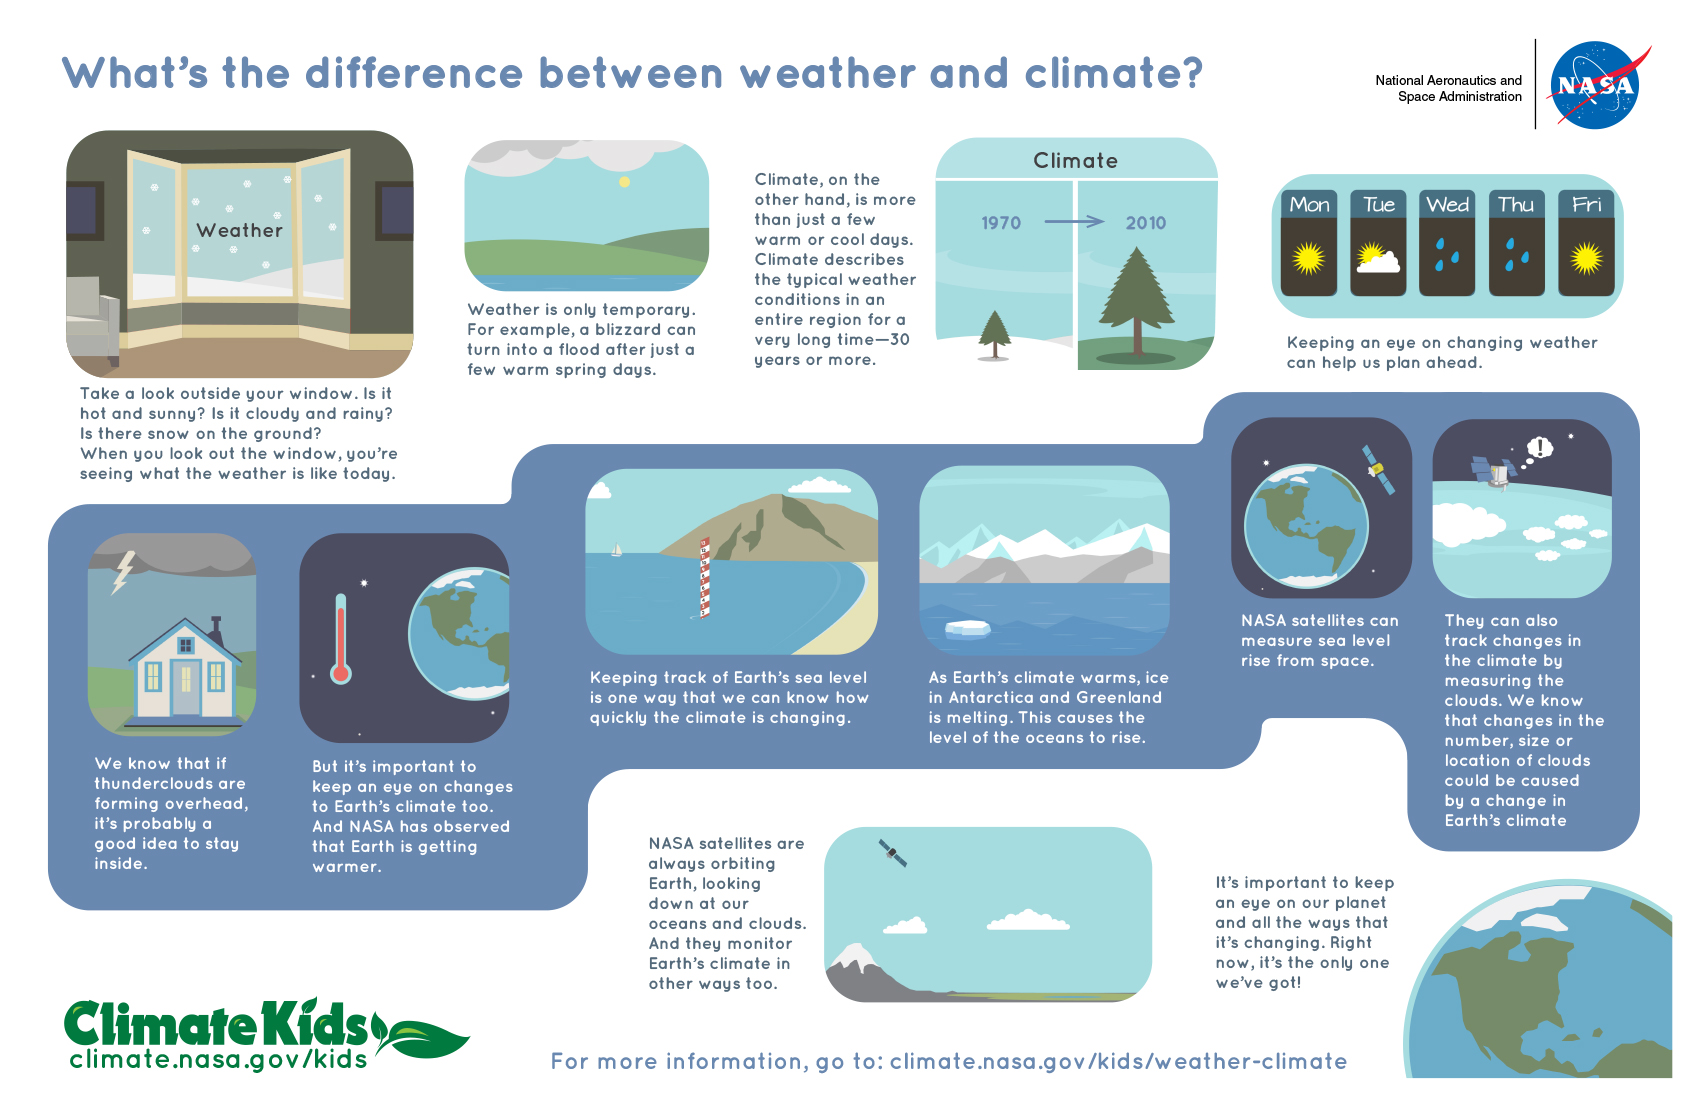
- NASA Climate Kids, “What’s the Difference Between Weather and Climate.” (Video, Poster, Transcript of Video)
Discover more from Slow Reveal Graphs
Subscribe to get the latest posts sent to your email.